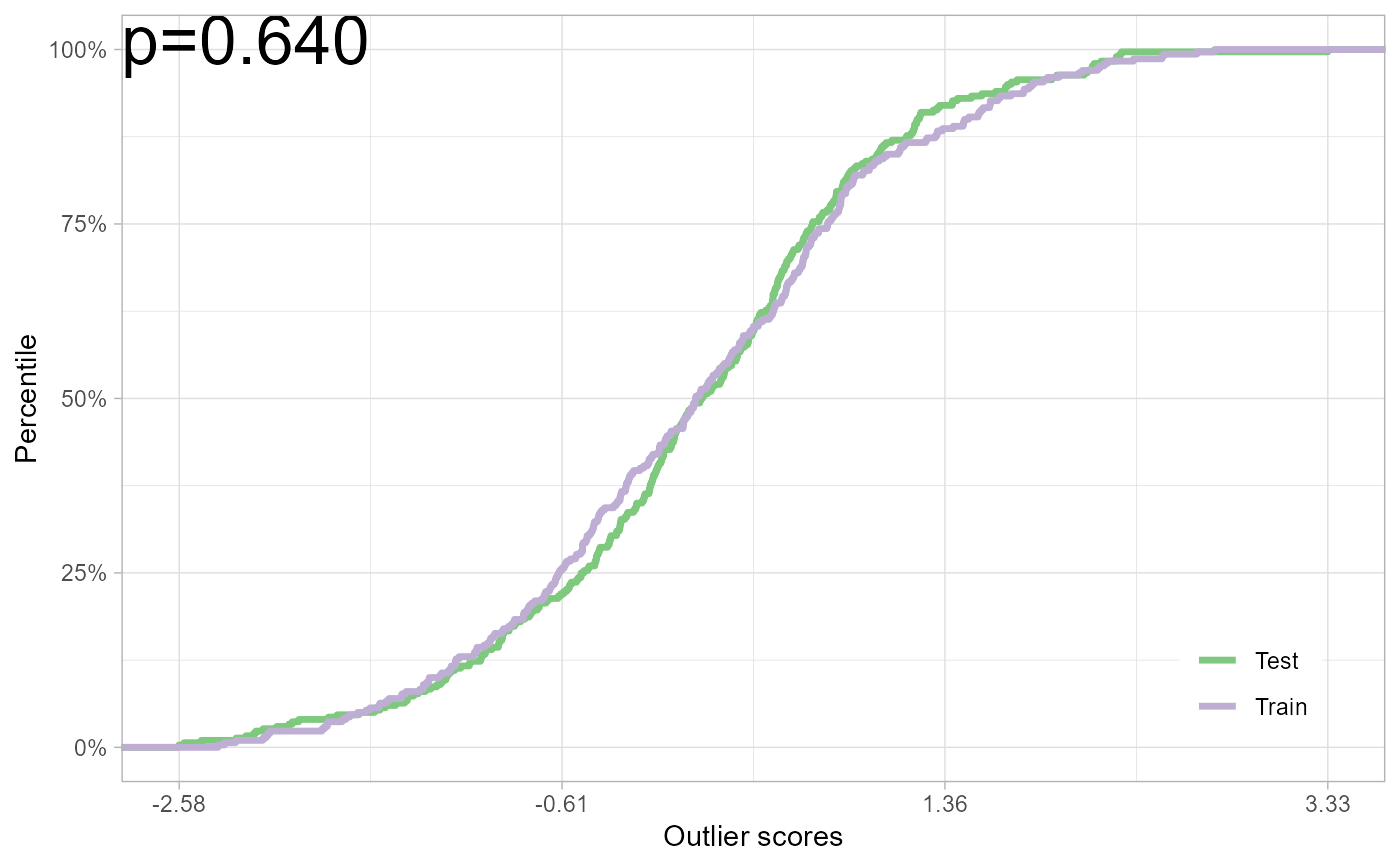
Plot frequentist test for no adverse shift.
# S3 method for outlier.test
plot(x, ...)
Arguments
- x
A
outlier.testresult from test of no adverse shift.- ...
Placeholder to be compatible with S3 method
plot.
Value
A ggplot2 plot with outlier scores and p-value.
See also
Other s3-method:
plot.outlier.bayes(),
print.outlier.bayes(),
print.outlier.test()
Examples
# \donttest{
set.seed(12345)
os_train <- rnorm(n = 3e2)
os_test <- rnorm(n = 3e2)
test_to_plot <- at_from_os(os_train, os_test)
# Also: pt_from_os(os_train, os_test) for permutation test
plot(test_to_plot)

# }
# }